Use Cases
The "Use Cases" section demonstrates how to effectively utilize the available tools to address specific questions or challenges within the EBA-regulated banking landscape. Each use case provides a step-by-step guide to operating the tools, showcasing their functionality and potential benefits. From exploring datasets to conducting targeted analyses, these examples help users understand the practical value of the tools in real-world scenarios. By illustrating common applications, this section empowers users to maximize the utility of the tools for their specific needs and objectives.
Use Case 1: Trading Activity
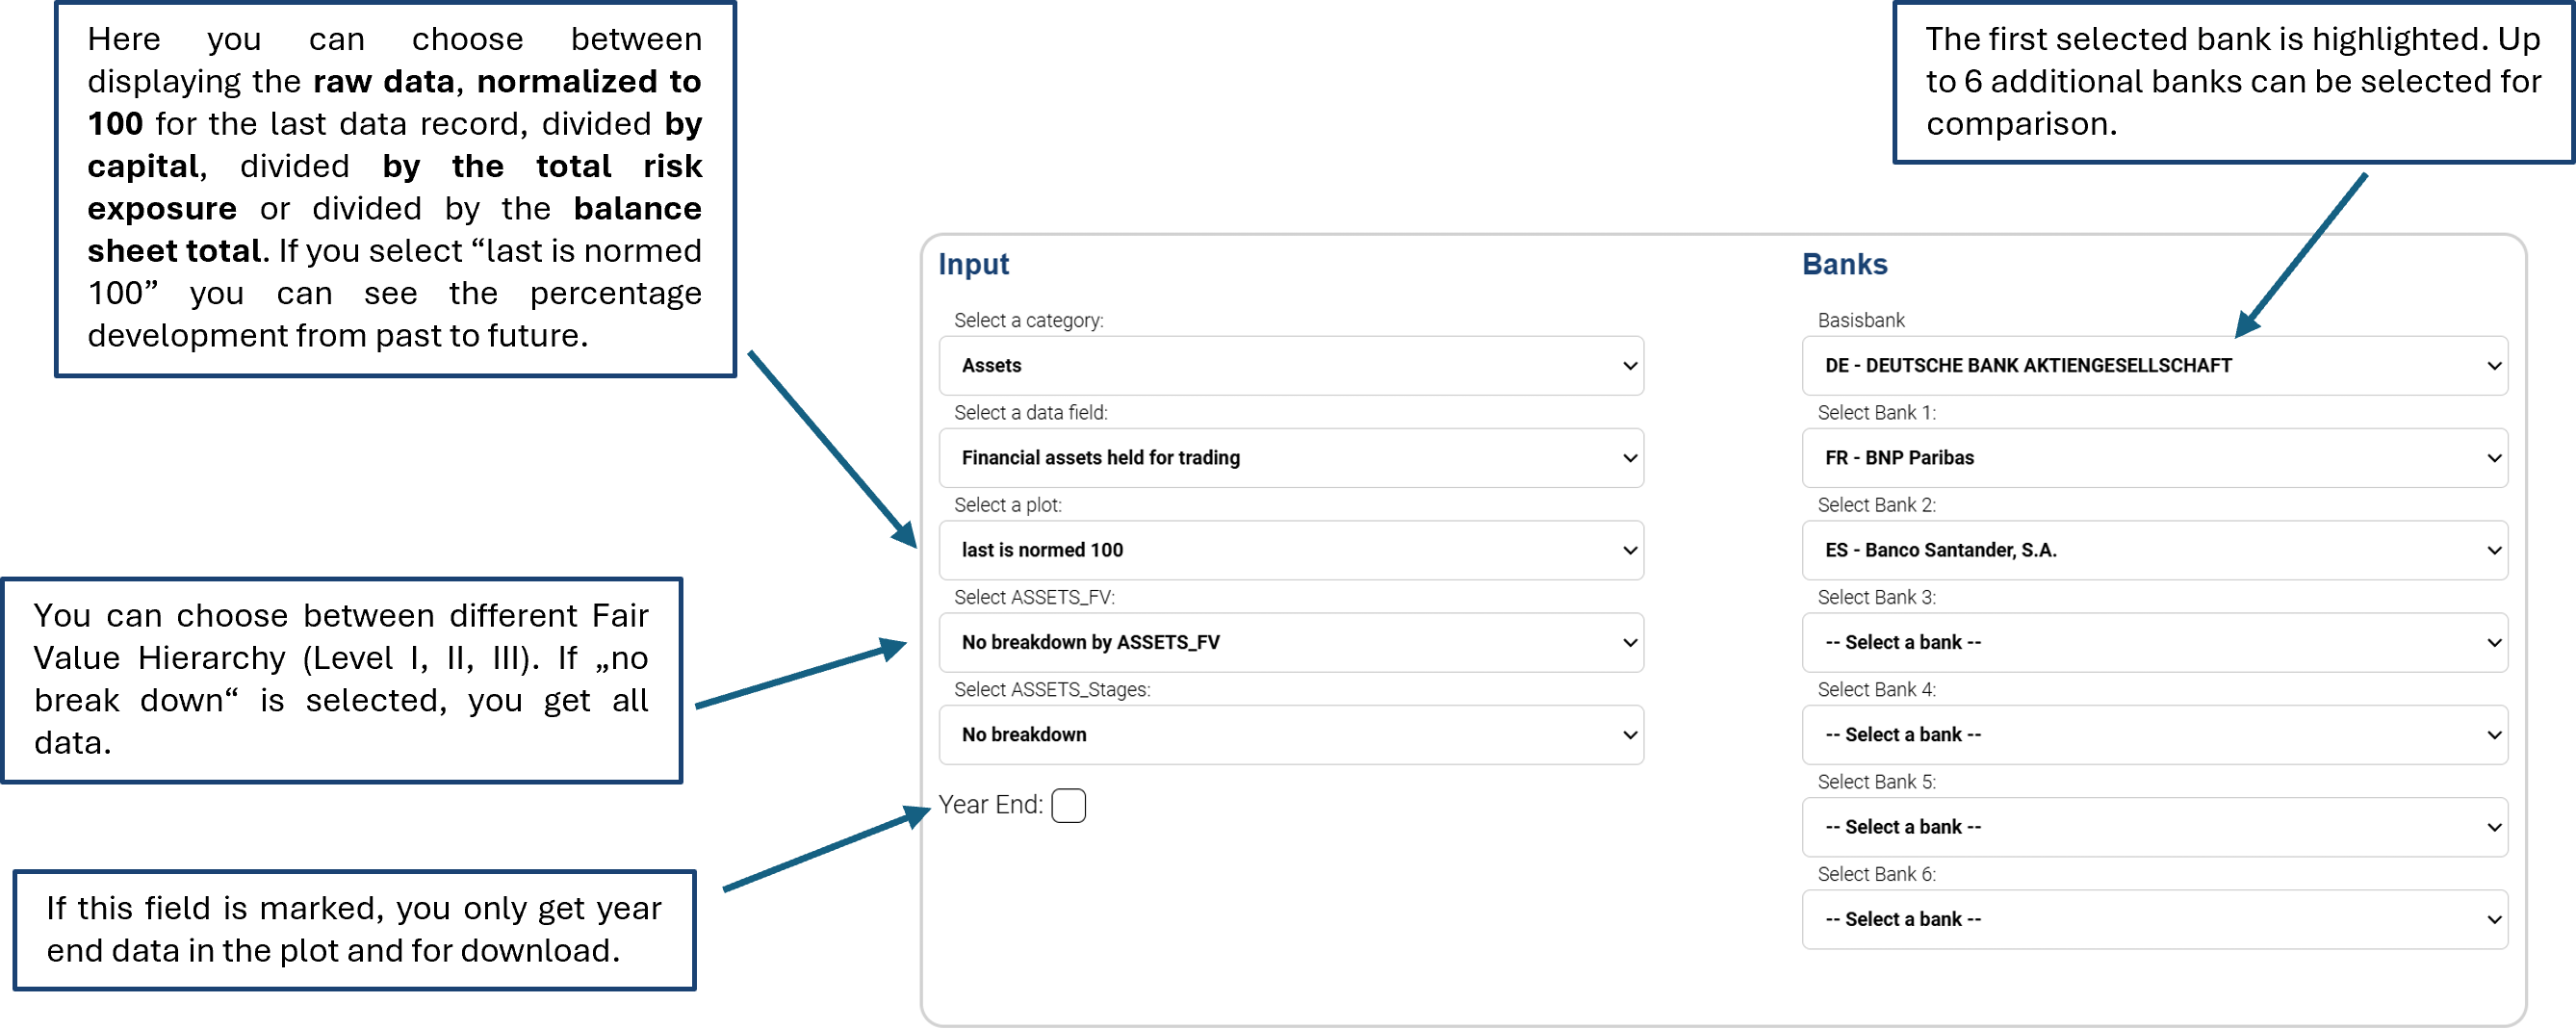
One possible question would be how trading portfolios in assets have changed at selected banks in recent years. This would allow conclusions to be drawn about the strategy of the individual banks. The Time Series Tool can be used for this purpose. The corresponding EBA field can be selected in “Assets - Financial assets held for trading”:
After executing the query, the results are displayed graphically and the corresponding data can be downloaded. A description of the selected field is also displayed. This is the resulting plot:
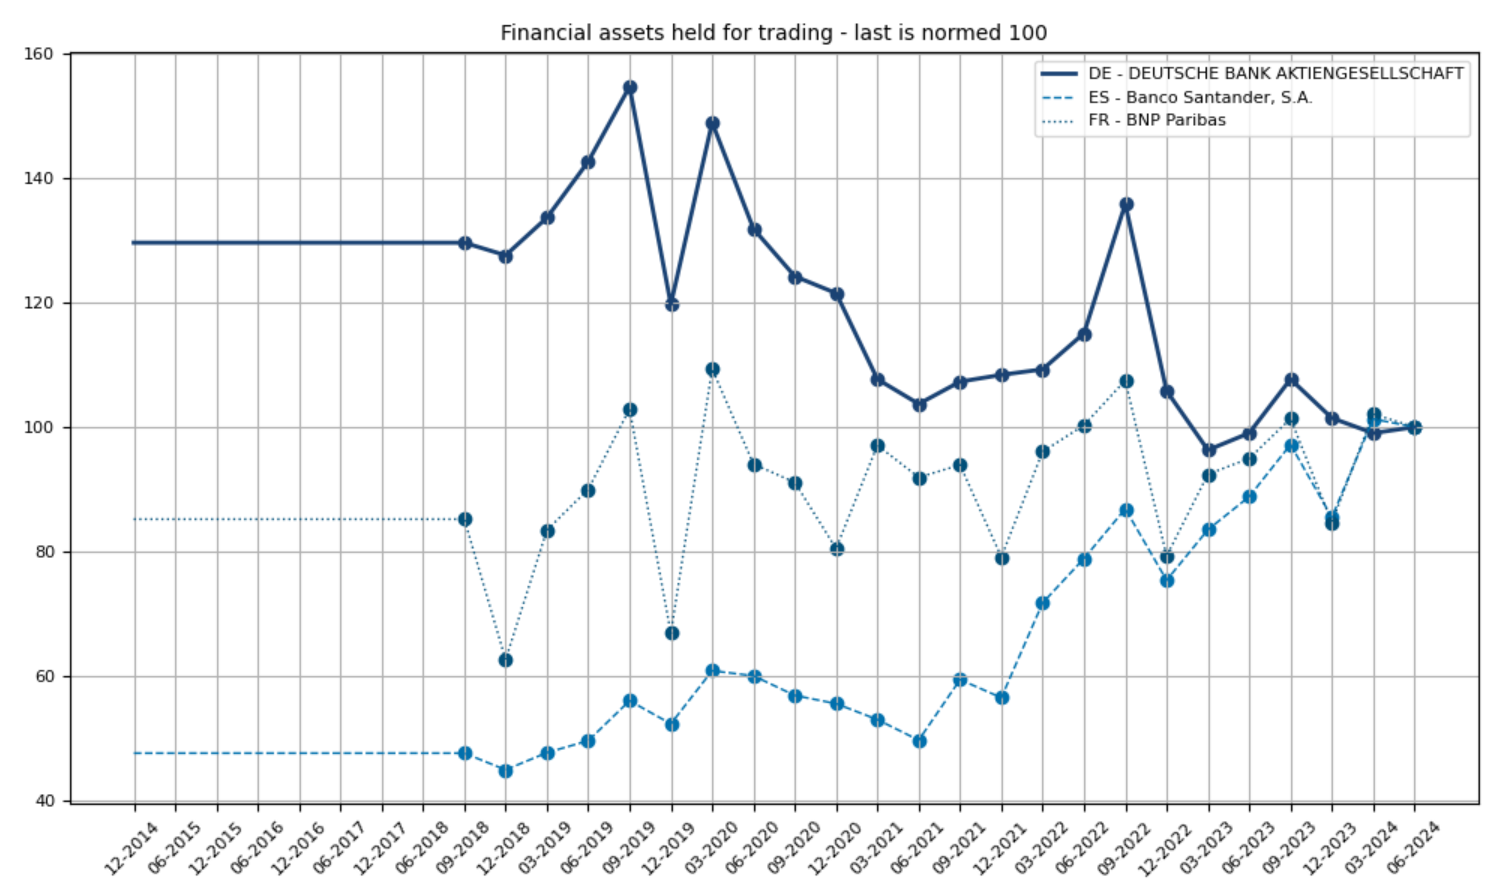
Deutsche Bank has reduced its asset holdings in the Trading Book by 20% compared to the end of 2019. BNP Paribas is almost unchanged and Banco Santander has almost doubled its holdings. Further analysis can be carried out by selecting the Fair Value Hirachy level.
Use Case 2: Credit Risk Exposure
To determine which bank has the largest credit risk exposure in a specific type (e.g. corporate) and a specific country (e.g. Germany), you can proceed as follows:
Select the EBA Landscape Tool. Under Credit Risk and then “Original Exposure - by exposure class (SA_and_IRB)”, you can select the corresponding country (Select Country Risk) and the corresponding exposure type (Select Exposure). You are interested in the latest data and therefore select the last possible entry as the start and end of the observation period:
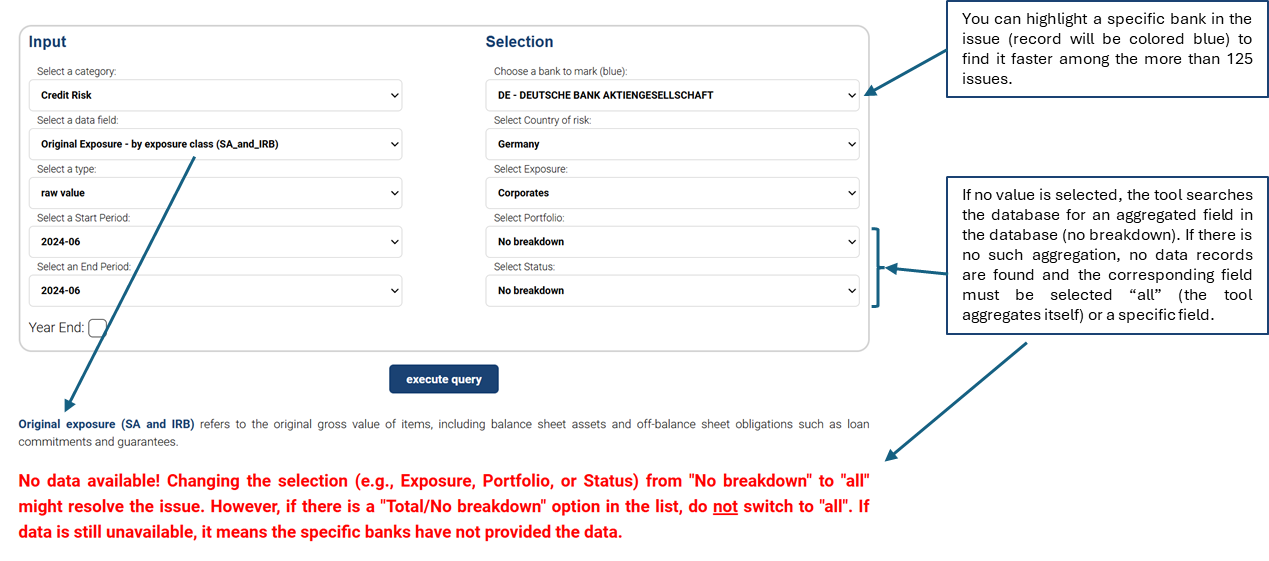
The tool suggests that the two fields Portfolio and Status should be set to “all”. The tool issues a new warning that it is now aggregating itself. As no “no breakdown” is available for either field, the warning can be ignored. The tool also indicates that at least one bank is outputting implausible data. This is not usually critical. The result is as follows, automatically sorted in descending order according to the last column:
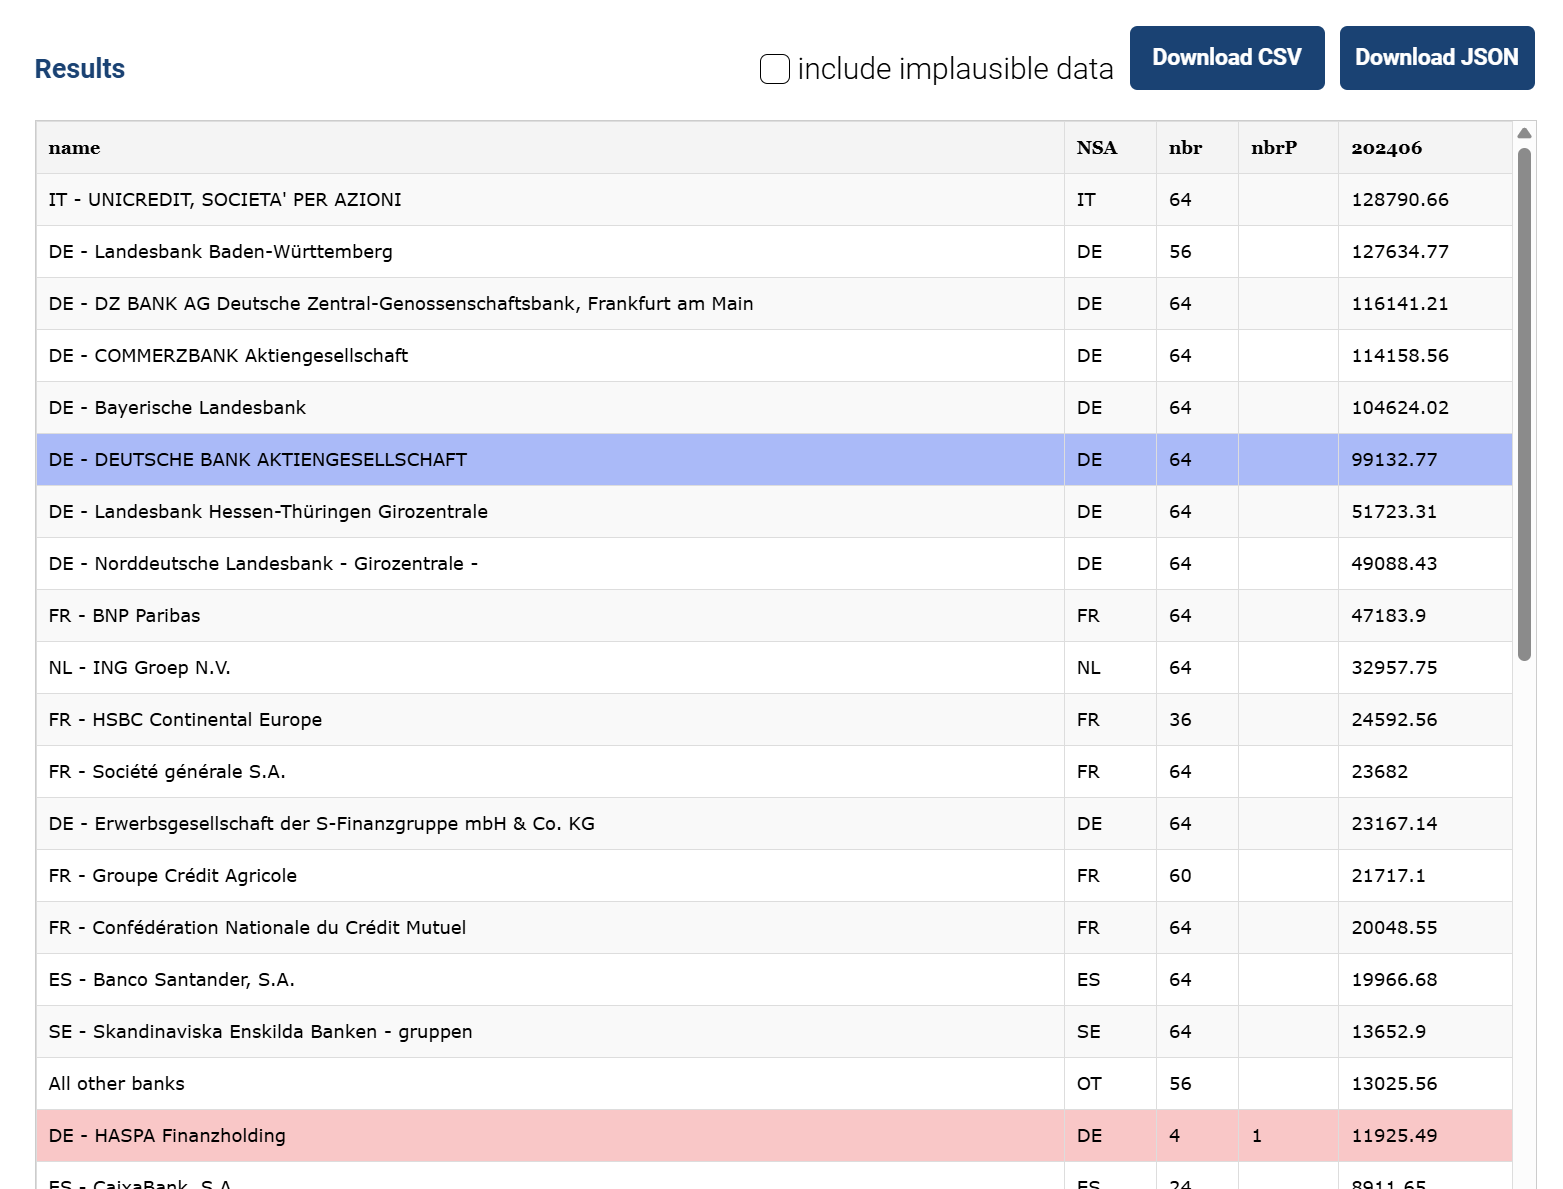
DE - HASPA Finanzholding is marked in red because a different amount of data was expected. This is usually not critical, but you can exclude this dataset when downloading the data.
Use Case 3: Liabilites
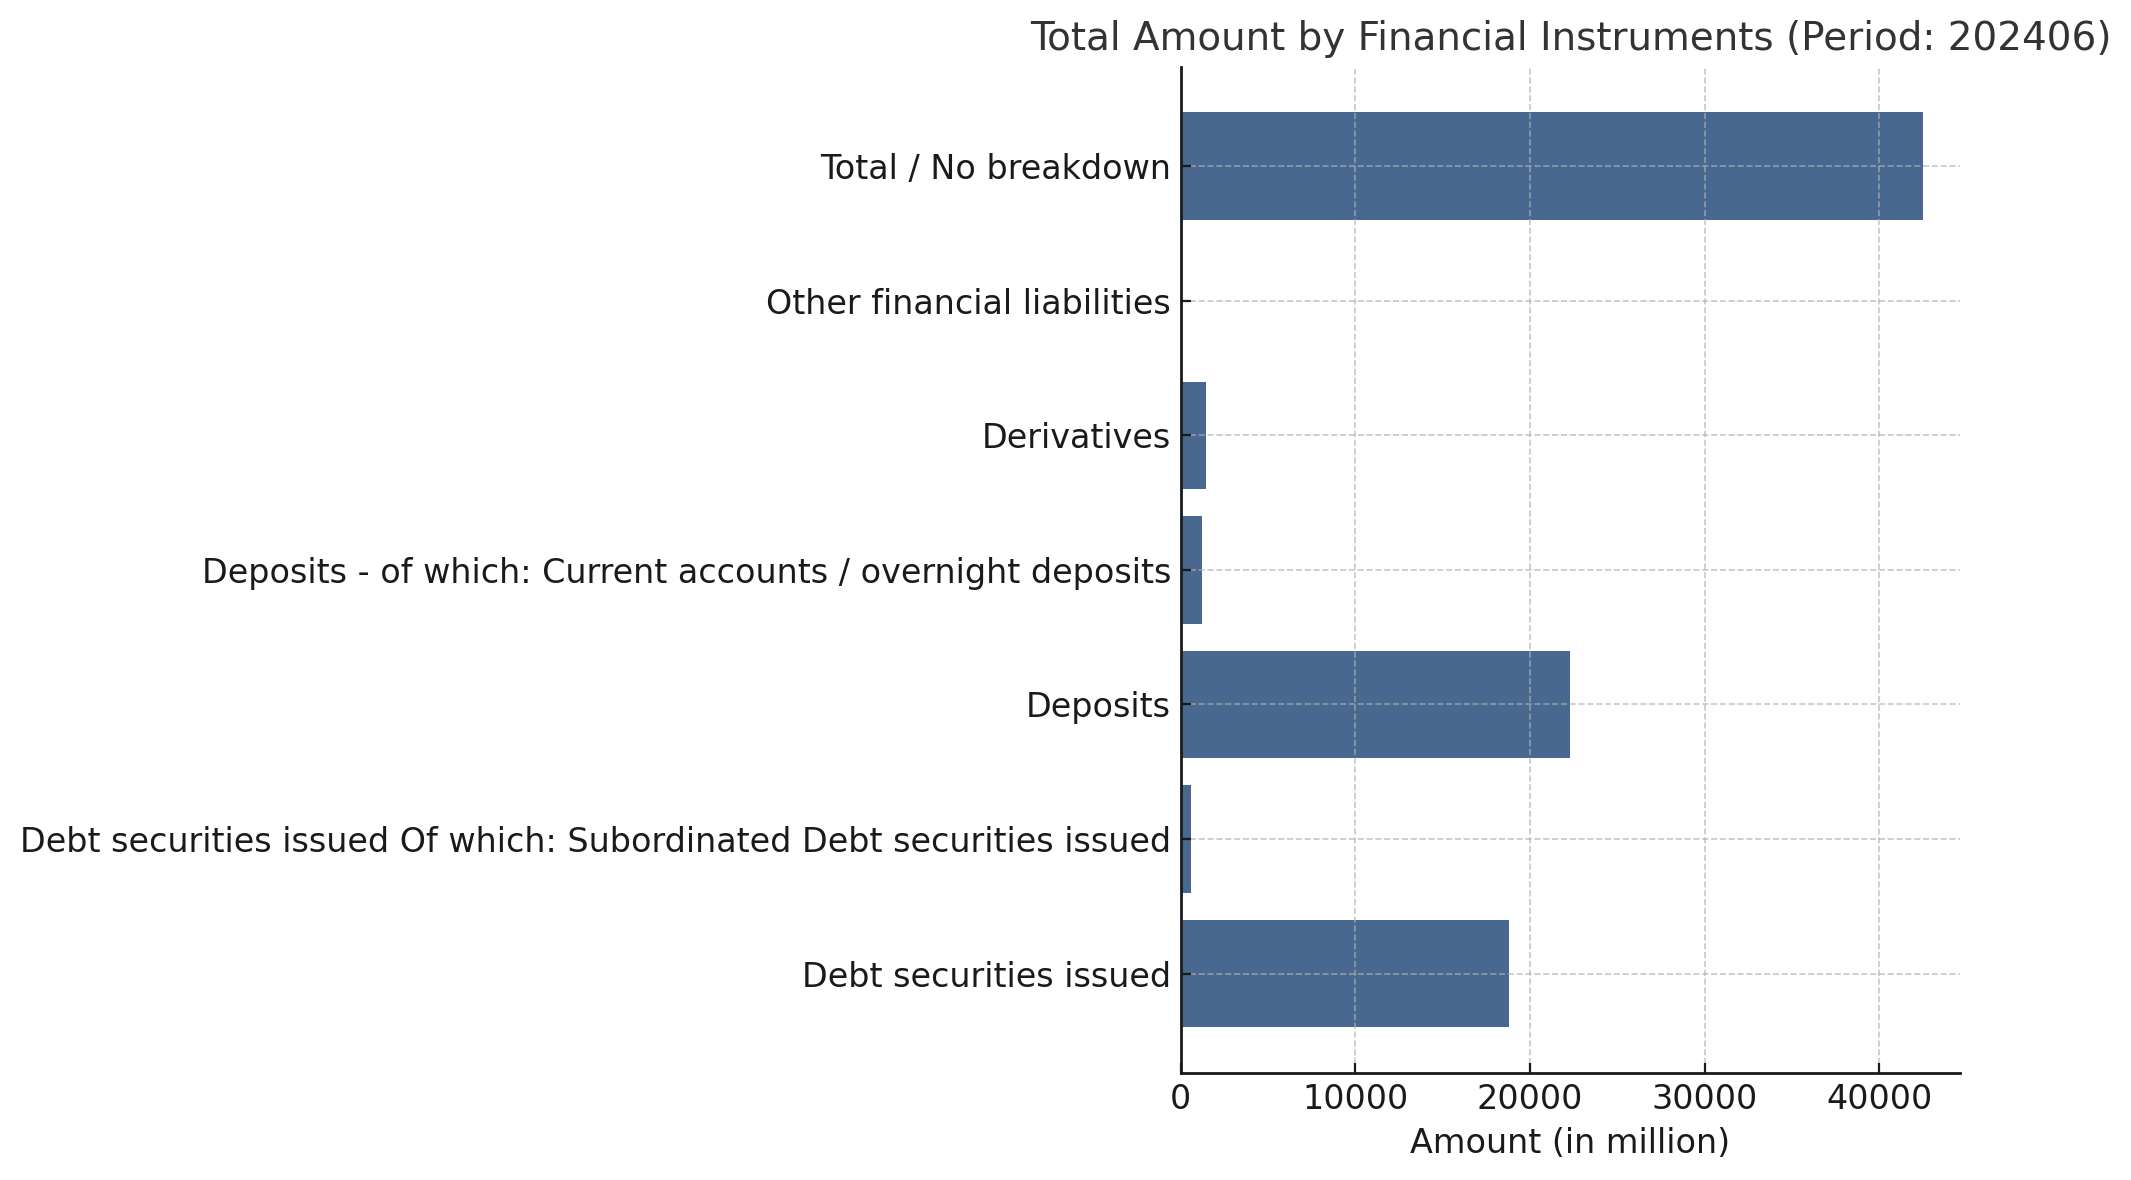
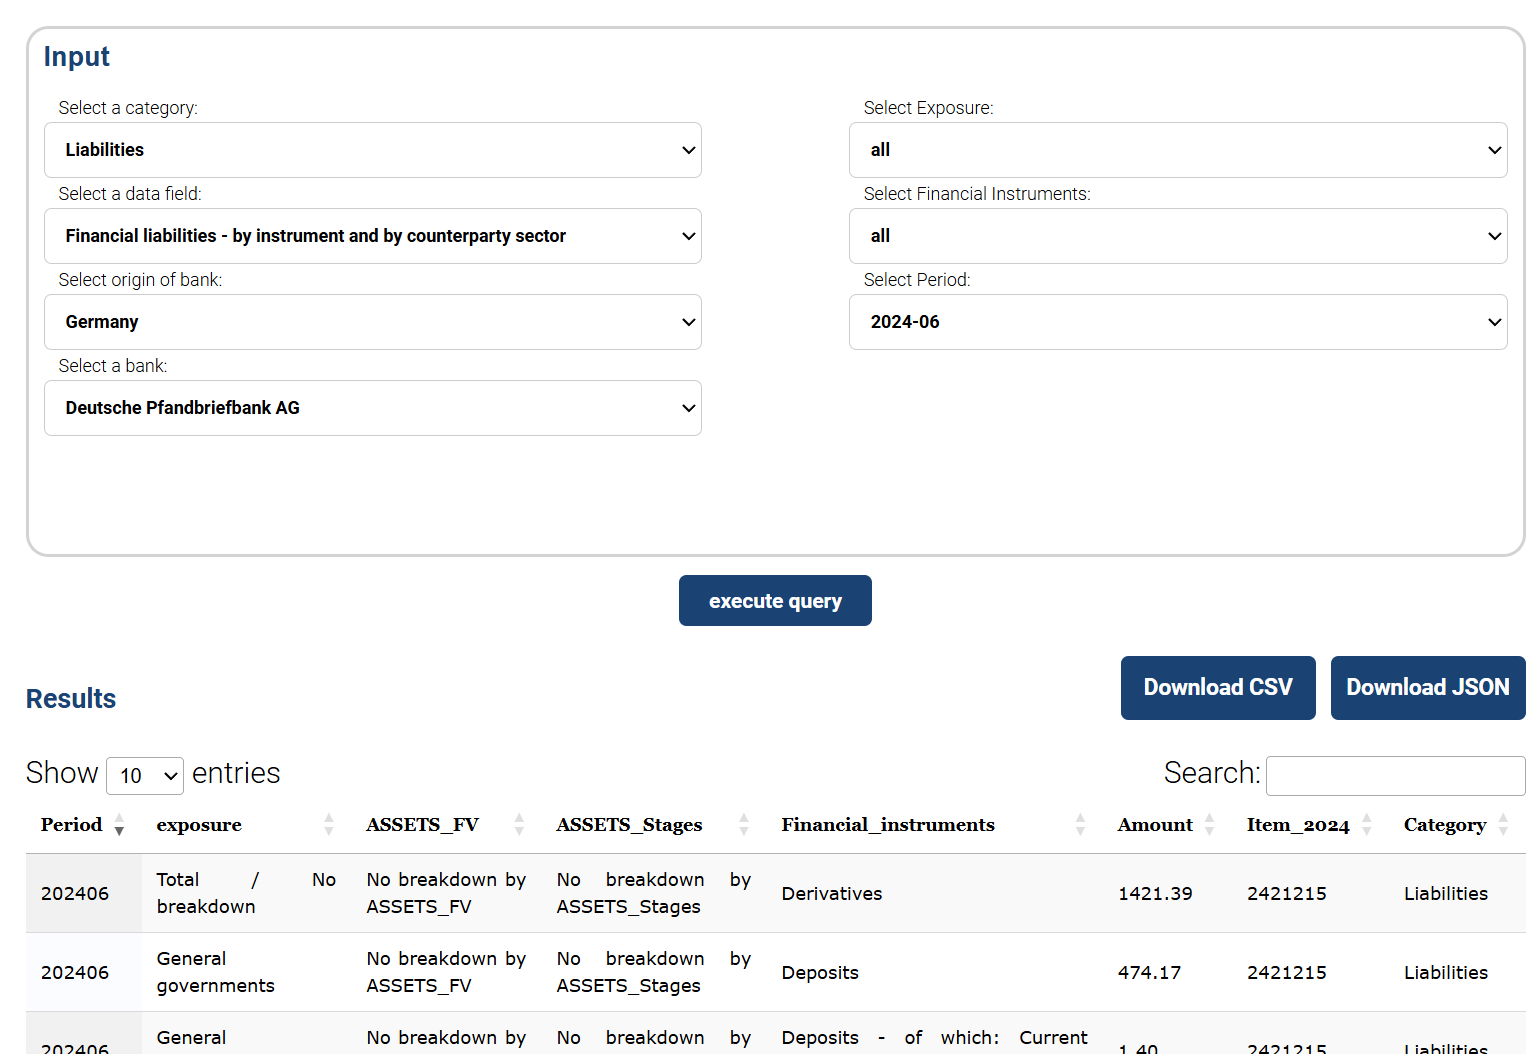
You would like to take a closer look at the liability structure of a bank. By using the Download Tool, you can download the data from the EBA database for a specific bank and a specific period:
You can now download the data and analyze it yourself. The data can also be passed on to Large Language Models. For example, if you pass the JSON from the above data to ChatGPT and add the following prompt:
“Can you please prepare this data for me in the form of graphics? Please use the color code #1a4273.”
you get the following output: